Are Walsh home prices moving up, down, or holding steady? If you’re thinking about buying or selling in Parker or Tarrant Counties, you want more than headlines — you want a clear, local read. In this quick guide, you’ll learn which Walsh market metrics matter most, how to interpret them, and what they mean for your timing and strategy. You’ll also see how to get a custom, neighborhood‑level snapshot before you act. Let’s dive in.
What drives the Walsh market
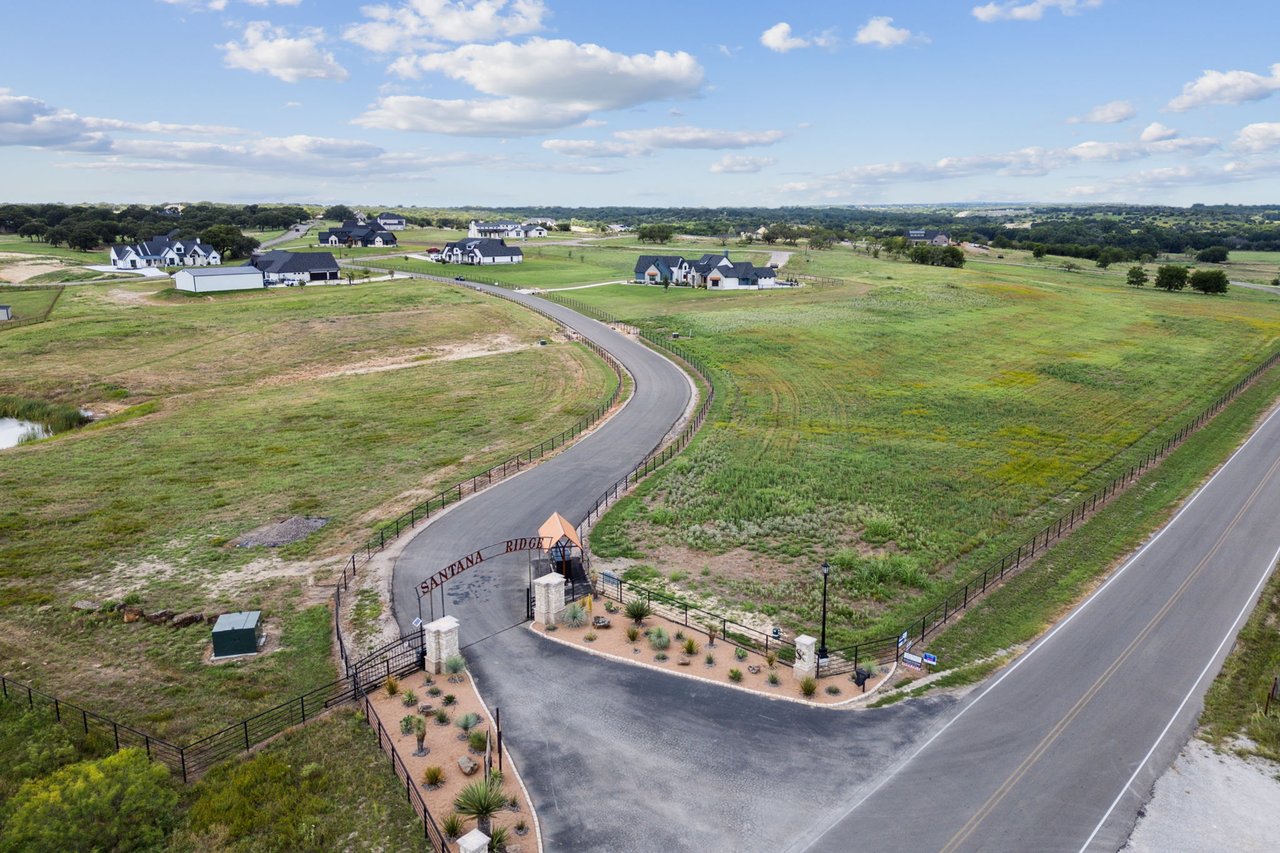
Walsh is a master‑planned community, which means supply often changes in phases. When builders release new lots or finish inventory homes, active listings can jump, and incentives may shift buyer behavior.
Amenities and community openings can lift demand. New parks, trails, and community features tend to draw more showings and support prices, especially near newly completed amenities.
Regional context matters too. Parker and Tarrant Counties growth and shifts in mortgage rates affect affordability and the size of the active buyer pool. Keep an eye on both local inventory and broader rate trends when you plan your move.
How to read prices in Walsh
Median sold price vs. list price
Start with the median sold price over the last 30, 90, and 365 days. Short‑term changes show momentum, while a 12‑month view smooths out seasonality. Pair this with the sale‑to‑list price ratio to see negotiation power. Ratios near 100% suggest competitive offers, while readings below 98% point to discounting.
Price per square foot context
Compare the median price per square foot within Walsh to nearby neighborhoods and to broader Parker and Tarrant Counties figures. New construction often carries a premium, so compare homes within the same phase, lot size range, and finish level. Resale homes with major recent upgrades can also command stronger $/sqft.
Inventory and pace: the signals to watch
Active and new listings
Track the count of active listings and the number of new listings hitting the market each month. A rising trend without a matching rise in pending sales usually means more choice for buyers and more competition for sellers.
Days on market, simplified
Median days on market (DOM) shows how quickly well‑priced homes go under contract. Very short DOM signals strong demand. If DOM is rising month over month, activity is cooling and buyers may have more room to negotiate.
Absorption rate and months of inventory
Absorption helps you see balance between supply and demand. Use this simple guide:
- MOI = Active inventory ÷ Average monthly closed sales
- Interpretation:
- Less than 3 months: seller’s market
- 3 to 6 months: balanced market
- More than 6 months: buyer’s market
When MOI tightens and DOM shortens at the same time, sellers hold the edge. If MOI rises and sale‑to‑list weakens, buyers gain leverage.
New construction vs. resale in Walsh
Master‑planned communities often have a meaningful share of new construction. Builders may offer incentives like rate buydowns, closing cost credits, or design upgrades. These reduce your effective cost even when list prices look firm.
Compare new construction to resale by looking at effective price after incentives, delivery timing, and warranty coverage. For resale, weigh the value of established landscaping, window treatments, and after‑market upgrades.
What this means for buyers
Use data to time your offer
- Watch MOI and DOM. If MOI is high and DOM is rising, you may have stronger negotiating power.
- Ask about builder incentives. A rate buydown can change your monthly payment more than a small list‑price cut.
- Focus on like‑for‑like comps within Walsh phases. Lot size, orientation, and finish level matter.
Make your offer stand out
- Get pre‑approved before touring to move quickly on well‑priced homes.
- If it’s competitive, consider flexible closing dates or limited but essential contingencies.
- Price to the phase and features, not just the average $/sqft.
What this means for sellers
Price and presentation win
- Anchor list price to recent pending and closed comps in your phase and finish tier, not the highest sale in the community.
- If DOM is lengthening, lead with condition and marketing. Small pre‑list improvements and standout visuals help protect your sale‑to‑list ratio.
Strategy by market pace
- In a seller’s market: launch with strong photography and a clear offer deadline to create urgency.
- In a balanced or buyer’s market: consider modest buyer credits or rate buydown options to widen your buyer pool.
How to get current numbers for Walsh
You deserve up‑to‑date, neighborhood‑level data before you make a move. The most accurate source for Walsh is the local MLS (NTREIS), supported by Parker and Tarrant Counties appraisal records for confirmation.
Here’s a simple plan to get a current snapshot:
- Pull last 90‑day and 12‑month MLS stats for Walsh: median sold price, sale‑to‑list ratio, median DOM, closed sales, active inventory, and pending count.
- Calculate MOI by dividing today’s active listings by the average monthly closed sales over the last 6 to 12 months.
- Note the share of new construction versus resale to understand how incentives might affect pricing.
- Timestamp everything, for example: “90‑day snapshot through [date].” Neighborhoods move fast.
Quick checklist: prices, inventory, trends
Use this checklist to keep your decisions data‑driven:
- Prices: median sold price and price per square foot for the last 30/90/365 days.
- Competition: sale‑to‑list ratio and number of offers on recent comps.
- Supply: active listings, new listings, and months of inventory.
- Speed: median days on market and trend direction.
- New vs. resale: incentives, warranty coverage, and effective cost.
Ready for a hyperlocal update tailored to your home or search? Reach out to Anabel Wright for a custom Walsh market brief or to Request a Free Home Valuation. Prefer to chat in Spanish? Hablamos español.
FAQs
Is now a good time to buy a home in Walsh Community?
- Check months of inventory and median days on market; higher MOI with rising DOM plus builder incentives can favor buyers, while low MOI and short DOM point to a more competitive environment.
How are Walsh prices trending compared with Parker and Tarrant Counties overall?
- Compare Walsh’s median price and $/sqft over the last 12 months to countywide figures; if Walsh outperforms, amenities and limited supply may be factors, while large lot releases can temporarily soften prices.
How long are Walsh homes taking to sell right now?
- Look at median days on market for the last 30, 90, and 365 days; faster sales indicate stronger demand, while lengthening DOM suggests buyers have more negotiation room.
Are builders currently offering incentives in Walsh?
- Incentives change frequently; ask for a current summary of rate buydowns, closing cost credits, or upgrade packages and compare the effective monthly payment to similar resale options.
What should I watch when comparing Walsh homes across phases?
- Match recent comps by phase, lot size, orientation, and finish level, and account for HOA fees, upcoming amenities, and any planned lot releases that could influence near‑term supply and pricing.